
    # Install this plugin
    npm install @pinelab/vendure-plugin-metrics
Vendure Metrics plugin
A plugin to visualize your shops most important metrics. Includes server side visitor tracking to calculate conversion rate.
Getting started
- Configure the plugin in
vendure-config.ts:
import { MetricsPlugin } from "@pinelab/vendure-plugin-metrics";

plugins: [
  ...
    MetricsPlugin.init({
      // Consider displaying fewer months for shops with a lot of orders
      displayPastMonths: 13
    }),
    AdminUiPlugin.init({
      port: 3002,
      route: 'admin',
      app: compileUiExtensions({
        outputPath: path.join(__dirname, '__admin-ui'),
        extensions: [MetricsPlugin.ui],
      }),
    }),
  ...
]
- Rebuild your Admin UI
- Run a database migration to add the necessary tables to your database.
- Start your Vendure server and login as administrator
- You should now be able to add the widget
Advanced Metricsto your dashboard.
Metric results are cached in memory to prevent heavy database queries every time a user opens its dashboard.
Server side tracking
To enable visitor tracking, you need to call the mutation pageVisit on the client to log a visit. Without this mutation, no visitors are tracked at all.
You can optionally pass inputs to the pageVisit, which will be persisted on each request.
mutation {
  # Each of the inputs are optional
  pageVisit(
    input: { path: "/product/123", productId: "123", productVariantId: "456" }
  )
}
These inputs currently aren't used, but you can write a custom metric to get, for example the top visited products, or pages.
:warning: Not legal advice.
Ip addresses and user agents are anonymized, and can not be reversed after 24 hours. This also means the same visitor will be seen as a new visitor after 24 hours.
This should make this plugin compliant with GDPR, and allow you to track visits without cookie consent.
The default session length is 30 minutes. This can be overridden via sessionLengthInMinutes option. This means that new request from the same visitor after 30 minutes will be seen as a new visitor. Anything requests within the 30 minutes of the previous request will be counted as the same visitor.
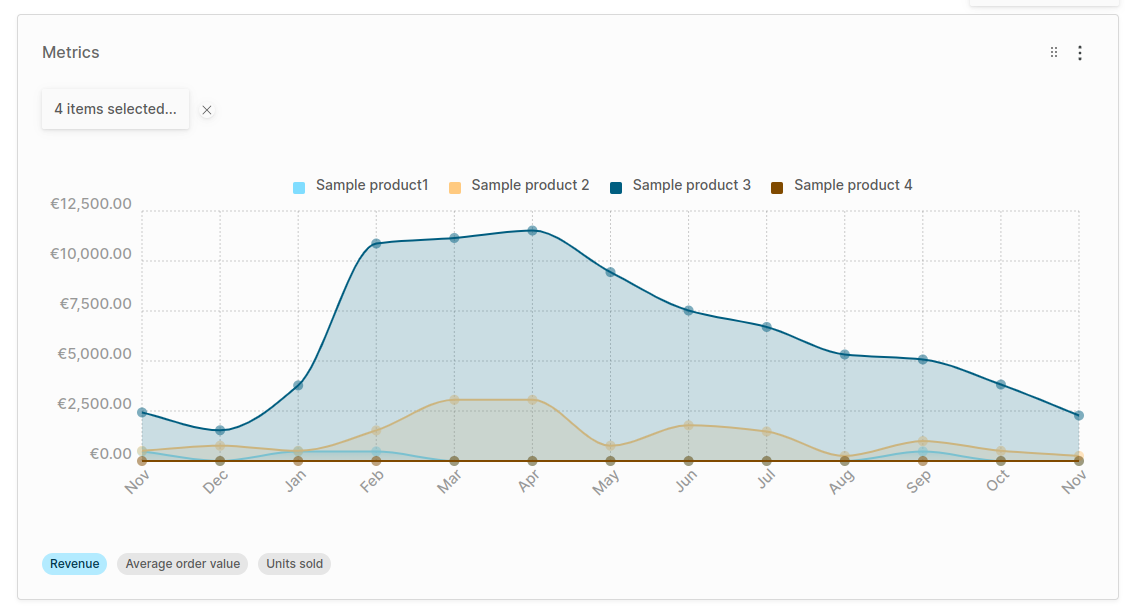
Built-in Metrics
- Revenue (per product): The total revenue per month, or the revenue generated by specific variants if a variant is selected.
- Average Order Value (AOV): The average of
order.totalWithTaxof the orders per month - Units sold: The number of units sold for the selected variant(s).
- Conversion Rate: The percentage of visitors that have converted to orders.
- Sessions: The number of sessions per month.
Custom Metrics
You can implement the MetricStrategy interface and pass it to the MetricsPlugin.init() function to have your custom metric visible in the Widget.
Below is the implementation of the conversion metric, already included in the plugin, but it serves as an example of how to implement a custom metric.
// This is the existing conversion metric, already included in the plugin

import { Order, RequestContext } from '@vendure/core';
import {
  AdvancedMetricType,
  Visit,
  MetricStrategy,
  NamedDatapoint,
} from '@pinelab/vendure-plugin-metrics';

/**
 * Conversion of sessions to orders
 */
export class ConversionMetric implements MetricStrategy {
  readonly metricType: AdvancedMetricType = AdvancedMetricType.Number;
  readonly code = 'conversion';
  readonly allowProductSelection = false;

  getTitle(ctx: RequestContext): string {
    return `Conversion Rate`;
  }

  calculateDataPoints(
    ctx: RequestContext,
    orders: Order[],
    sessions: Session[],
    variants: ProductVariant[]
  ): NamedDatapoint[] {
    // Here you would calculate your metric data points, based on the orders, sessions and variants

    const placedOrders = orders.length;
    const sessionCount = sessions.length;
    // Calculate conversion rate (as a percentage)
    let conversionRate = 0;
    if (sessionCount > 0) {
      conversionRate = (placedOrders / sessionCount) * 100;
    }
    if (conversionRate > 100) {
      // Conversion rate cannot be more than 100%
      conversionRate = 100;
    }

    // Most metrics return a single data point, which results in a single line in the chart.
    // But you can return multiple data points, which results in multiple lines in the chart.
    // For example, you could return a 'times purchased' per variant
    return [
      {
        legendLabel: 'Conversion Rate (%)',
        value: parseFloat(conversionRate.toFixed(2)),
      },
    ];
  }
}
Contributions
Special thanks to@dalyathan for his contributions on this plugin.
Need help? Get In Touch